
Screen 6/14 - Smart management
Growth: views and followers across every channel, added up from day one
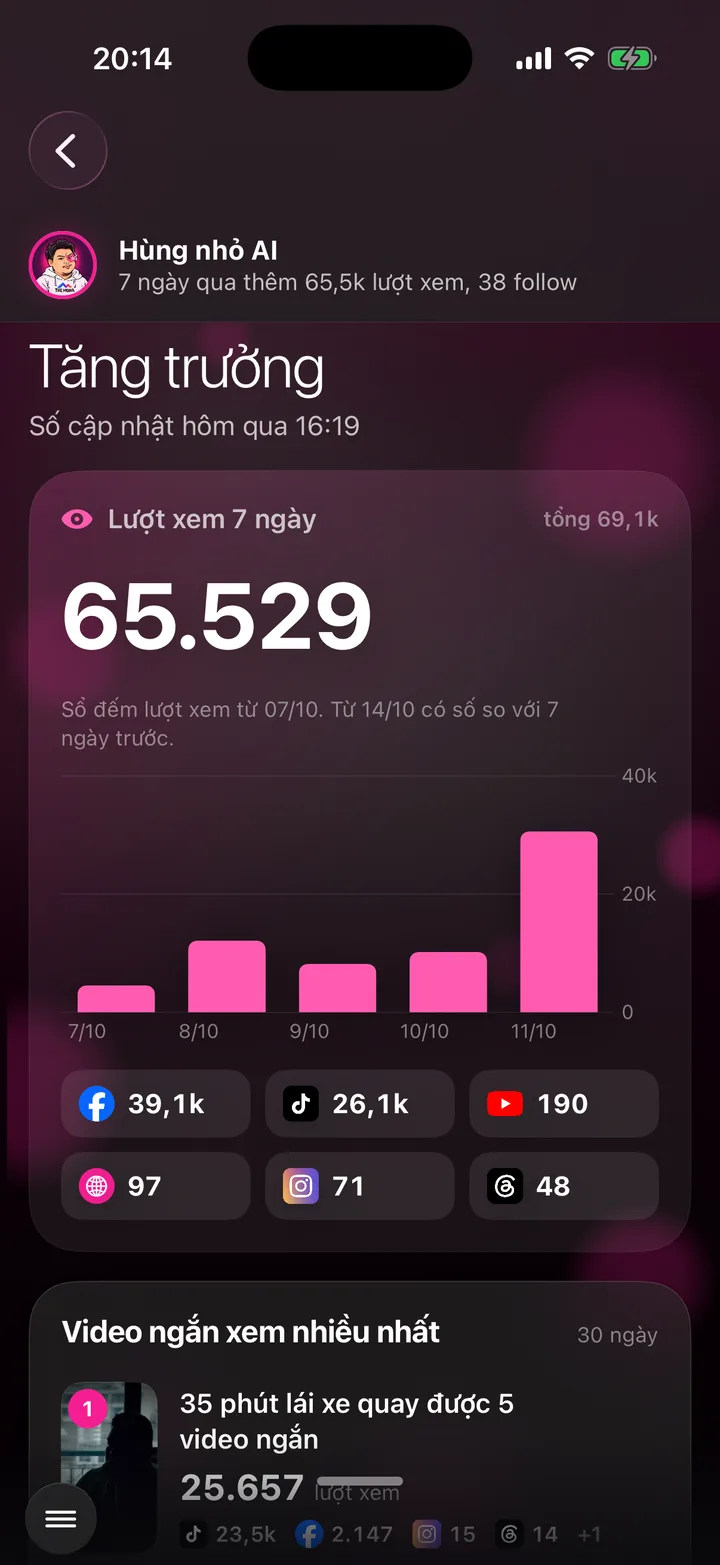

Two big numbers: views and followers, combined across every channel, added up from the day you started building channels. Plus a daily growth line, a per-channel table and your 5 most-viewed videos.
What this screen is for
Building channels without looking at the numbers is like driving without a dashboard. This screen pulls the numbers from every channel into one place, in two easy-to-read figures.
The first number is views: short videos and web posts on every channel. The second is followers: Facebook, YouTube, TikTok, Instagram, Threads and LinkedIn combined.
Every number adds up from your first day of building channels. Open it two months later and you see right away how many views those two months produced, not cut down to 7 days or 1 month.
Explainer video
Watch Khánh Hùng explain this feature
 1:25
 1:32
App demo video - Per-video reports chapter, from 8:18
Watch Khánh Hùng open this screen in the real app
Watch the full video on YouTube
Stats and reports
How much your channels grew, right there when you open the app
The assistant pulls every channel's numbers into one dashboard, updated hourly. You see which channel draws viewers and which video is worth a follow-up. At the weekend, it sums it all up in a short report sent straight to your phone.
- Real numbers from each platform itself, no estimates
- Every hour it updates itself, nobody edits by hand
- Every channel, every video has its own numbers
- Totals since day one show how far your channels have grown
Khánh Hùng's real channel numbers, updated live
Since Oct 7, 2026 - Day 36
- total views, all channels
- 886,131
- total views, all channels
- new followers
- +1,090
- new followers
- posts published
- 482
- posts published
Fetching the latest numbers
Source: the official APIs of Facebook, TikTok, YouTube, Instagram, Threads and LinkedIn, plus real view counts on the website. The MONA AI Station collects them every hour.
How to use it
Open the menu in the bottom left corner and choose Growth, the first item in the Tracking group. The top line sums up how many views you've had and how many followers you've gained since your first day of building channels.
The Total views block has a big number, a small line with this week's figure, and a cumulative line climbing day by day from day one. Tap a day to see the total up to that day.
Scroll down to Most-viewed short videos: 5 videos from the last 30 days, each with its views per channel.
Tap the Views or Follow number to open the per-channel table: View, Follow columns and the growth since your first day of building channels.
Tap a channel in the table to see that channel's own chart.
At the bottom are your website's Google numbers: clicks, impressions, average position, keywords in the top 10, compared with the previous 28 days.
Behind the scenes, what the assistant does
The MONA AI Station collects the numbers every hour straight from the platforms through official connections, no estimates.
If a platform doesn't allow reading follower counts, the table clearly says not connected, no made-up numbers.
Your assistant uses these same numbers to see which kinds of video are getting watched most and to suggest the next topic.
What you get
- A growth report that's always fresh, no waiting for someone to put together a month-end report.
- Know which channel is bringing viewers and which video is worth making more of.
- Real numbers to show your leadership team or partners.
Examples by industry
A doctor sees TikTok bringing most of this week's views while Facebook brings followers. The doctor asks the assistant to make more short Q&A videos.
A lawyer checks the website's Google numbers, sees the post on inheritance procedures in the top 10, and records more videos on the same topic.
A CEO screenshots the Growth screen and sends it to the board every Monday morning instead of a manual report.
Want this app under your name?
An assistant with your name, photo and colors, on iPhone and Android.
Implementation process